Over 200 million human beings have died in warfare across recorded history. These are the ten conflicts that account for the largest share of that staggering toll — ranked by total deaths, with verified data, historical context, and analysis.
At a Glance — Compiled Statistics from 10 Deadliest Conflicts
Sources: Oxford War Database · Armed Conflict Research Center · Britannica · UN OCHA · ACLED · CWPD
What Does It Take to Kill 200 Million People?
The Scale of Human Conflict
There is a number that most of us cannot truly grasp: 200 million deaths in warfare. Written out, it is 200,000,000 — a figure so large that it collapses into abstraction the moment you try to imagine it. It is roughly equivalent to killing every man, woman, and child in Brazil, or wiping out the entire population of Pakistan. Twice. It is what the ten deadliest wars in recorded history produced, combined, across roughly 800 years of organized human killing.
These are not statistics from a single campaign or a single century. The list spans Genghis Khan’s 13th-century horseback conquests, which killed an estimated 40 to 60 million people at a time when the total world population was around 400 million, to the industrial-scale slaughter of the 20th century, when two World Wars killed roughly 100 million people in less than 30 years. History, it turns out, has been very good at finding new ways to kill at scale.
“The more we learn about history’s deadliest wars, the harder it becomes to pretend that mass violence is the exception. The data suggests it may be the norm.”
— Oxford War Database, Conflict Data Research CentreWhat this article attempts to do — carefully, with verified data and proper sourcing — is rank these ten conflicts by total documented deaths, provide context for how those numbers were reached, and explain what separated each conflict’s scale from the dozens of other major wars in history. We use ranges throughout because war casualty figures are inherently imprecise: records are incomplete, civilians and combatants are often undistinguished in older data, and different historians use different counting methodologies.
Where possible, we have separated military deaths from civilian deaths. We have noted when figures are disputed among historians. And we have resisted the urge to round numbers upward for dramatic effect — because the actual, conservative numbers are already devastating enough. Every figure in this article represents a human life. That is the only context that matters.
Complete Ranking: All 10 Conflicts
Sorted by Total Deaths| # | War / Conflict | Period | Duration | Military Deaths | Civilian Deaths | Total Deaths (est.) | Bar Scale |
|---|---|---|---|---|---|---|---|
| 1 | World War II 🌍 Global · Allied vs Axis Powers | 1939–1945 | 6 yrs | 21–25M | 50–60M | 70–85M | |
| 2 | Mongol Conquests 🌏 Asia / Europe · Mongol Empire Expansion | 1206–1368 | 162 yrs | ~5M | 35–55M | 40–60M | |
| 3 | World War I 🌍 Global · Allied vs Central Powers | 1914–1918 | 4 yrs | 9–11M | 7–8M | 17–20M | |
| 4 | Taiping Rebellion 🇨🇳 China · Qing Dynasty vs Taiping Heavenly Kingdom | 1850–1864 | 14 yrs | ~5M | 15–25M | 20–30M | |
| 5 | Second Sino-Japanese War 🇨🇳🇯🇵 China vs Japan (overlaps WWII) | 1937–1945 | 8 yrs | 3–5M | 12–17M | 15–22M | |
| 6 | Russian Civil War 🇷🇺 Bolsheviks vs White Army + Foreign Forces | 1917–1922 | 5 yrs | 1–2M | 4–7M | 5–9M | |
| 7 | Second Congo War 🇨🇩 Africa · 9 Nations + 20 Armed Groups | 1998–2003 | 5 yrs | ~800K | ~4.6M | ~5.4M | |
| 8 | Napoleonic Wars 🌍 Europe · France vs Coalition Powers | 1803–1815 | 12 yrs | 2–3M | 1–3M | 3.5–6M | |
| 9 | Korean War 🇰🇷🇰🇵 North vs South Korea + China, US, UN | 1950–1953 | 3 yrs | 1.2–1.5M | 2–3.5M | 3–5M | |
| 10 | Vietnam War 🇻🇳 North vs South Vietnam + US Forces | 1955–1975 | 20 yrs | 700K–1.5M | 800K–2M | 1.5–3.5M | |
| Combined Estimated Total — All 10 Conflicts | ~200M+ | ||||||
ⓘ All death figures are estimates based on scholarly research and may vary between sources. Civilian deaths include famine and disease caused directly by conflict. The Second Sino-Japanese War (1937–1945) is sometimes counted within WWII figures; here it is listed separately. Bar scale is relative to WWII’s estimated maximum (85M = 100%). Sources: Oxford War Database, Correlates of War Project, Armed Conflict Research Centre, Encyclopædia Britannica.
Death Toll Visualized — Comparative Scale
Bar width = proportion of World War II’s estimated maximum (85 million = 100%). Note the dramatic dropoff after the top 2.
BAR WIDTH = % OF WWII MAXIMUM (85M) · ALL FIGURES ARE SCHOLARLY ESTIMATES · CIVILIAN DEATHS INCLUDED
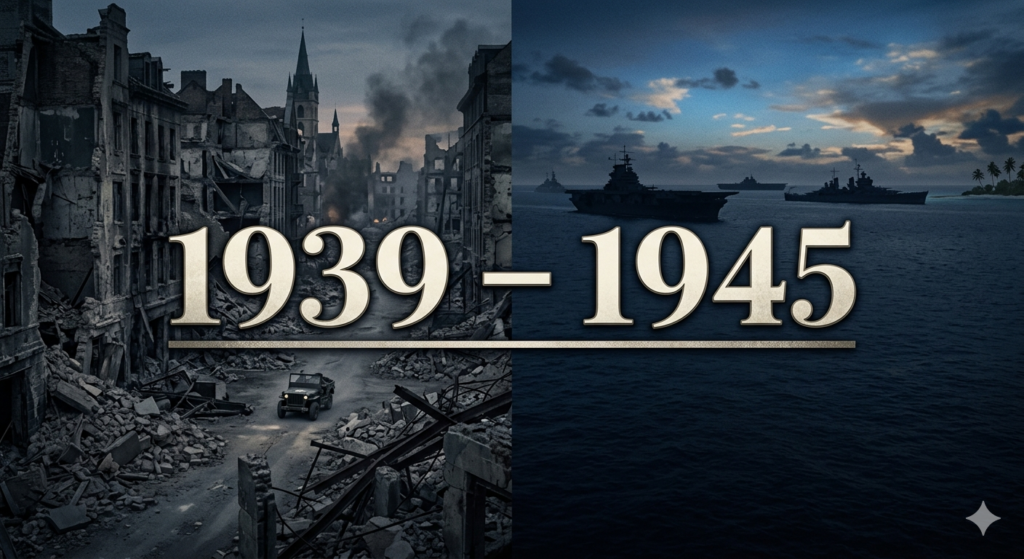
World War II
1939 – 1945 · Global · Allied Powers vs Axis Powers
| Nation / Theater | Military Deaths | Civilian Deaths | Total Estimate | Notes |
|---|---|---|---|---|
| Soviet Union | 8–10M | 16–19M | 26–29M | Largest national death toll of any country |
| China | 3–4M | 8–12M | 15–20M | Overlaps with 2nd Sino-Japanese War |
| Germany | 4.5–5.3M | 1.5–3M | 6–8M | Including Holocaust victims |
| Holocaust | — | 5.7–6.1M | ~6M | Jewish victims; total Holocaust ~11M |
| Poland | ~240K | 5–6M | ~6M | ~17% of prewar population |
| Japan | 2.1–2.3M | 500K–800K | 2.6–3.1M | Including atomic bomb deaths |
| United States | ~407K | ~12K | ~420K | Lowest among major powers |
| United Kingdom | ~383K | ~67K | ~450K | Civilian deaths primarily from bombing |
| France | ~217K | ~350K | ~567K | Includes resistance fighters and deportees |
| GLOBAL TOTAL | 21–25M | 50–60M | 70–85M |
Why Was World War II So Deadly?
No conflict in human history has killed more people than World War II — and the reason is not simply military technology, though that played a role. The answer lies in three converging factors: industrial-scale genocide, the first time in history that a state systematically murdered millions of civilians as a policy objective; total war doctrine, which deliberately targeted civilian populations via strategic bombing and siege warfare; and unprecedented geographic scale, with combat occurring simultaneously across Europe, North Africa, the Pacific, Southeast Asia, and the Atlantic Ocean.
The Soviet Union suffered the most — an estimated 26–29 million deaths, roughly one in every six Soviet citizens alive in 1939. The Eastern Front, where Germany and the USSR fought from 1941 to 1945, accounted for more deaths than all other theaters of World War II combined. The siege of Leningrad alone killed approximately 800,000 civilians from starvation and bombardment — more than the United States lost in the entire war.
The Holocaust is documented as the deliberate murder of approximately six million Jewish people and five million others — Roma, disabled people, political prisoners, Soviet POWs — by Nazi Germany and its collaborators. It was the largest state-sponsored genocide in history, conducted via industrial methods including poison gas chambers at purpose-built extermination camps. This component alone would rank among the deadliest events in human history independent of the military conflict surrounding it.
Year-by-Year Death Estimates
1939: Estimated 300,000 deaths (Poland invasion, Winter War begins). 1940: ~500,000 deaths (Western campaign, Battle of Britain). 1941: ~8M deaths (Operation Barbarossa, Pearl Harbor, Holocaust escalation). 1942: ~15M deaths (Stalingrad, Pacific campaigns, Holocaust peak). 1943: ~16M deaths (Kursk, Pacific island-hopping, Italian campaign). 1944: ~18M deaths (D-Day, Eastern Front, Pacific, strategic bombing). 1945: ~12M deaths (Berlin, Pacific, atomic bombs, final campaign).
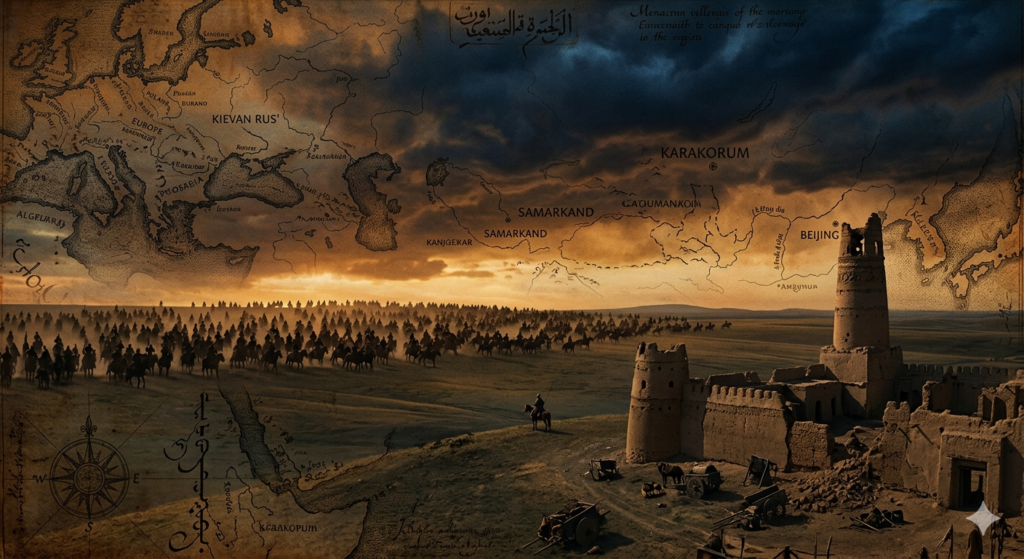
The Mongol Conquests
1206 – 1368 · Asia, Middle East, Eastern Europe · Mongol Empire
At the time of the Mongol Conquests, the total world population was approximately 350–400 million. The estimated 40–60 million deaths therefore represented roughly 10–15% of all people alive on Earth — a proportion far exceeding even World War II (which killed approximately 3–4% of the global population at the time). This makes the Mongol Conquests, by proportion of global population, arguably the most devastating demographic catastrophe in human history.
What Made the Mongol Conquests So Lethal?
Beginning with Genghis Khan’s unification of the Mongol tribes in 1206 and continuing under his sons and grandsons — including Ögedei, Möngke, and Kublai Khan — the Mongol Empire’s expansion killed an estimated 40 to 60 million people across Asia, the Middle East, and Eastern Europe over roughly 160 years. The numbers are staggering for an era of pre-industrial warfare, and they require explanation.
The primary mechanism was not merely battlefield deaths, which were relatively modest compared to 20th-century warfare. The Mongol armies — typically numbering between 100,000 and 150,000 mounted warriors — operated on a deliberate policy of destruction: cities that surrendered were often spared, while those that resisted were systematically razed and their populations killed. Baghdad, in 1258, saw the destruction of what was then arguably the world’s greatest city and the estimated killing of 200,000 to 1 million people in a single siege — ending the Islamic Golden Age in a matter of days.
Secondary deaths from the Mongol campaigns were enormous. The conquest of northern China devastated agricultural infrastructure across some of the most densely populated regions on Earth, triggering famines that killed tens of millions. The destruction of the sophisticated irrigation systems of Central Asia — the Khwarezmian Empire’s heartland — turned fertile regions into desert within decades, with population collapses estimated at 80–90% in some areas. These “consequential deaths” from disrupted food systems and abandoned cities are included in most scholarly casualty estimates.
Geographic Breakdown of Deaths
China and East Asia: 30–40 million (largest share — North China’s population fell from ~60M to ~9M between 1200 and 1300). Central Asia / Persia: 8–12 million. Middle East: 2–4 million (Baghdad, 1258, was the most concentrated single event). Russia and Eastern Europe: 500,000–2 million. These figures carry significant uncertainty due to the age of the records, but multiple independent scholarly analyses converge on the 40–60 million range.
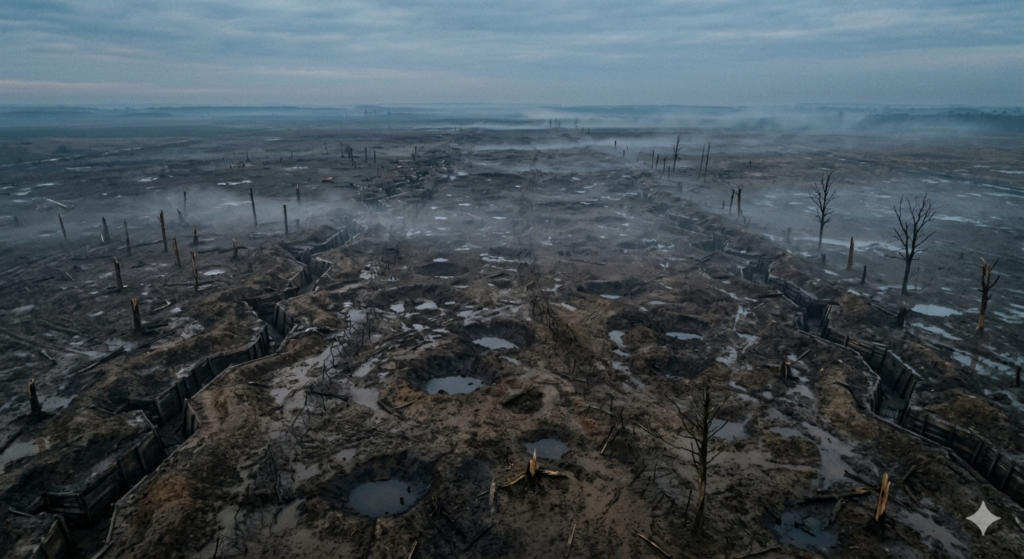
World War I
1914 – 1918 · Global · Allied Powers vs Central Powers
The First Industrial War
World War I, known at the time simply as “The Great War,” introduced a new era of industrialized killing. Machine guns, artillery barrages lasting weeks, poison gas, aerial bombing, and submarine warfare combined to produce approximately 9–11 million military deaths — a figure that shocked a world unprepared for warfare at that scale. The four-year stalemate on the Western Front, where armies advanced and retreated across the same 30–50 kilometers of Belgian and French soil for four years, represents one of the most efficient killing machines in history.
The Battle of the Somme (July–November 1916) remains one of the bloodiest single engagements ever recorded. On the first day alone — July 1, 1916 — the British Army suffered 57,470 casualties, of whom 19,240 were killed. In four months of combat, the battle produced approximately 1 million total casualties on both sides, advancing the Allied line by roughly 12 kilometers. The arithmetic of that exchange became the defining horror of the 20th century.
Civilian deaths in WWI came primarily from three sources: the blockade of Germany and Austria-Hungary (causing an estimated 750,000 deaths from malnutrition); the Armenian Genocide (1915–1916, in which approximately 600,000 to 1.2 million Armenians were killed by the Ottoman state); and widespread disease, particularly the 1918 Spanish Flu pandemic, which emerged partly in the conditions created by mass troop movements and killed an estimated 50–100 million people globally — though those deaths are typically counted separately from the war’s direct toll.
| Nation | Side | Military Deaths | Wounded | Notes |
|---|---|---|---|---|
| Russia | Allied | 1.7–2M | 4.9M | Withdrew 1917 after revolution |
| Germany | Central | 1.8–2M | 4.2M | Highest military casualties of any nation |
| France | Allied | 1.3–1.4M | 4.3M | ~4% of total population killed |
| Austria-Hungary | Central | 1.1–1.2M | 3.6M | Empire dissolved after defeat |
| Ottoman Empire | Central | ~771K | 400K | Armenian Genocide concurrent (600K–1.2M) |
| British Empire | Allied | ~886K | 2.1M | Includes dominion forces (Canada, India, etc.) |
| United States | Allied | ~116K | 204K | Entered 1917; relatively low casualties |
| Italy | Allied | ~462K | 953K | Switched sides from Central Powers 1915 |
| TOTAL ALL SIDES | 9–11M | ~21M |
Wars #4–10: Full Profiles
Verified DataLed by Hong Xiuquan, who believed himself to be the brother of Jesus Christ, the Taiping Heavenly Kingdom controlled large swaths of southern China for 14 years. The conflict killed an estimated 20–30 million people — more than WWI — through direct combat, famine, and the destruction of agricultural regions across the Yangtze River delta. It remains one of the deadliest civil wars in any country in history, yet receives remarkably little attention in Western historical education. Some historians rank it #3, ahead of WWI, depending on which death estimates they use.
SOURCES: Jonathan D. Spence, ‘God’s Chinese Son’ · Encyclopædia Britannica · The Oxford War Database
Often counted within WWII’s broader statistics, the Second Sino-Japanese War was in many ways its own enormous conflict, beginning in 1937 — two years before Germany invaded Poland. The Nanjing Massacre (December 1937–January 1938) alone saw an estimated 40,000–300,000 Chinese civilians killed by Japanese forces over six weeks. Japan’s campaign of strategic bombing of Chinese cities, biological weapons use, and deliberate starvation of captured populations produced a civilian death toll that dwarfed military losses.
SOURCES: Rana Mitter, ‘China’s War with Japan’ · The Oxford War Database · Iris Chang, ‘The Rape of Nanking’
The chaos that followed the 1917 Bolshevik Revolution drew 14 foreign armies into Russia — including British, US, Japanese, and French forces — alongside a brutal internal civil war between the Bolshevik Red Army and the counter-revolutionary White Army. Disease and famine killed more people than direct combat: typhus alone killed an estimated 2–3 million. The 1921–22 famine that followed the war and its economic disruption killed a further 1–5 million. The conflict ended with Bolshevik victory and the establishment of the Soviet Union.
SOURCES: Orlando Figes, ‘A People’s Tragedy’ · Evan Mawdsley, ‘The Russian Civil War’ · Correlates of War Project
Called “Africa’s World War” by historians, the Second Congo War involved nine African nations and approximately 20 armed factions fighting across the Democratic Republic of Congo from 1998 to 2003. The vast majority of the estimated 5.4 million deaths were from disease and starvation caused by displacement and the destruction of health infrastructure — direct combat deaths were a fraction of the total. It remains the deadliest conflict since World War II after the Korean War. Violence in the eastern DRC continues to this day.
SOURCES: International Rescue Committee (IRC) · Human Rights Watch · ACLED · UN OCHA
Napoleon Bonaparte’s campaigns across Europe, Egypt, the Caribbean, and Russia — combined with the ongoing Peninsula War in Spain — produced an estimated 3.5 to 6 million deaths across 12 years. The catastrophic 1812 Russian campaign alone killed approximately 400,000 French soldiers (from battle, cold, and starvation) and hundreds of thousands of Russian military and civilian casualties. The wars reshaped the political map of Europe entirely and produced a death toll that, as a proportion of Europe’s population, was comparable to WWI. Disease killed more soldiers than combat in nearly every campaign.
SOURCES: David Gates, ‘The Napoleonic Wars’ · The Oxford War Database · Correlates of War Project
Often called “The Forgotten War” in the United States — sandwiched between WWII and Vietnam — the Korean War was in fact an enormously destructive conflict that killed an estimated 3–5 million people, the majority of them Korean civilians. The US dropped more bombs on North Korea during the conflict than it dropped on the Pacific theater in all of WWII — destroying an estimated 75% of North Korean cities and infrastructure. The war ended in an armistice (not a peace treaty) in 1953; technically, North and South Korea remain at war today.
SOURCES: Bruce Cumings, ‘The Korean War’ · US Department of Defense · Correlates of War Project
The Vietnam War lasted 20 years, drew in US military forces from 1965, and produced an estimated 1.5–3.5 million deaths — figures that still carry significant uncertainty. North and South Vietnamese military deaths together account for an estimated 700,000–1.5 million. Civilian deaths, from bombing campaigns (including extensive use of napalm and Agent Orange defoliant), numbered in the hundreds of thousands to over 1 million. The US alone dropped more than twice the total tonnage of bombs used in all of WWII across Vietnam, Laos, and Cambodia. The war ended with North Vietnamese victory and reunification in 1975.
SOURCES: Nick Turse, ‘Kill Anything That Moves’ · Vietnam’s Ministry of Labour · Correlates of War Project · US National Archives
What Do These Numbers Tell Us About History — And About Today?
The 20th Century Was Uniquely Deadly
Six of the ten deadliest wars in history occurred between 1914 and 1975 — a 60-year period. Industrial technology applied to warfare produced a scale of killing that no previous era could match.
Civilians Die More Than Soldiers
In every conflict on this list, civilian deaths equal or exceed military deaths. The ratio has worsened over time: in WWI, roughly half of deaths were military; in WWII, over two-thirds were civilians.
Famine Kills More Than Bullets
In conflicts like the Russian Civil War, Second Congo War, and Korean War, disease and famine caused by conflict killed far more people than direct combat. War destroys the systems that keep people alive.
The Good News: Wars Are Getting Rarer
Despite 2026’s escalating conflicts, Steven Pinker and others have documented a long-term decline in war deaths per capita since 1945. The data suggests we are in a historically unusual period of relative peace — until very recently.
One number that helps contextualize the scale: the world’s population during the Mongol Conquests was approximately 400 million. Losing 50 million people to that campaign was equivalent to losing 12.5% of all humanity. By comparison, World War II — the deadliest conflict in raw numbers — killed 70–85 million out of a world population of roughly 2.3 billion, or approximately 3–4%. The Mongol Conquests, adjusted for world population, were the more proportionally devastating event.
What the data also reveals is an uncomfortable truth about the relationship between technology and lethality. Each era finds new ways to kill more people more efficiently: the Mongol era used horses and logistics; WWI introduced industrial artillery and poison gas; WWII added aerial bombardment, nuclear weapons, and systematic genocide. The question that historians and military analysts ask about 2026 is whether drone warfare, hypersonic missiles, and potential unconventional weapons will write the next chapter of this pattern — or whether the post-WWII institutions and deterrence systems will hold.
As of 2026, active global conflicts including Ukraine, Gaza, Sudan, and the Iran-Israel-US escalation have collectively produced an estimated 626,000+ deaths — a significant figure, but still many orders of magnitude smaller than the conflicts in this ranking. Whether 2026 represents a temporary escalation or the beginning of a trend toward larger conflict is a question our data will answer — in real time.
Top Questions About History’s Deadliest Wars
What is the deadliest war in human history?
+World War II (1939–1945) is the deadliest war in recorded history by total deaths, with an estimated 70–85 million dead. This includes approximately 50–60 million civilians — killed through strategic bombing, genocide, famine, and displacement — and 21–25 million military deaths. The Soviet Union alone lost an estimated 26–29 million people. However, if you measure by percentage of global population killed, the Mongol Conquests (1206–1368) were more devastating, accounting for roughly 10–15% of all people alive on Earth at the time.
How many people died in World War II?
+Estimates range from 70 million to 85 million total deaths. The range exists because civilian deaths — particularly from famine, disease, and persecution in occupied territories — are difficult to verify. The Holocaust alone killed approximately 11 million people (6 million Jewish victims and 5 million others). The Soviet Union’s losses of 26–29 million remain the largest of any single country. Military deaths totalled approximately 21–25 million across all sides; the remaining 50–60 million were civilian deaths.
Which war killed the highest percentage of the world’s population?
+The Mongol Conquests (1206–1368) killed the highest proportion of the global population. The estimated 40–60 million deaths occurred when the world’s total population was approximately 350–400 million, meaning roughly 10–15% of all humanity perished during the Mongol Empire’s expansion. World War II, by comparison, killed approximately 3–4% of the world’s population. This is why many historians argue the Mongol Conquests were — in terms of human impact relative to scale — the most catastrophic event in history.
How many people died in World War I?
+Approximately 17–20 million people died in World War I (1914–1918). Military deaths totalled 9–11 million, making it one of the deadliest military conflicts ever, while civilian deaths reached 7–8 million. Germany suffered approximately 1.8–2 million military deaths — the highest of any single nation — while France lost about 4% of its total population. This figure does not include the 1918 Spanish Flu pandemic, which emerged partly in wartime conditions and killed an estimated 50–100 million people globally — though those deaths are counted separately.
What is the deadliest war most people have never heard of?
+The Taiping Rebellion (1850–1864) in China is almost certainly the most catastrophic war that receives the least attention in Western education. Led by a man who believed himself to be Jesus Christ’s brother, the conflict lasted 14 years and killed an estimated 20–30 million people — more than World War I. Some historians rank it #3 in all of history. The Second Congo War (1998–2003), which killed approximately 5.4 million people and involved nine nations, is another major conflict that rarely features in mainstream historical accounts.
Are wars getting less deadly over time?
+The long-term historical trend since 1945 has been toward fewer war deaths per capita globally. Historian Steven Pinker documented this extensively in his research. However, the period from 2022–2026 has shown a significant reversal of this trend, with simultaneous large-scale conflicts in Ukraine, Gaza, Sudan, and the newly escalated Iran-Israel-US conflict producing over 626,000 combined deaths. Whether this represents a temporary spike or a structural shift in the global conflict environment is actively debated among conflict researchers and analysts at ACLED, CSIS, and other institutions.
Data Sources & Methodology
How casualty estimates are compiled, why figures vary, and the primary sources used in this article
Why figures are presented as ranges: War casualty figures — especially for historical conflicts — carry significant uncertainty. Different historians use different counting methodologies: some include only direct combat deaths, others include famine and disease deaths caused by conflict, and others include genocide deaths separately. We present ranges that reflect the scholarly consensus and note where significant disagreement exists. We do not inflate numbers for dramatic effect.
Civilian vs military deaths: In most modern historical research, civilian deaths significantly outnumber military deaths in the conflicts on this list. This is particularly true of the Mongol Conquests, WWII, and the Second Congo War. We report military and civilian deaths separately wherever data allows.
- Keegan, John — ‘The First World War’ (1998)
- Beevor, Antony — ‘The Second World War’ (2012)
- May, Timothy — ‘The Mongol Conquests in World History’ (2012)
- Spence, Jonathan — ‘God’s Chinese Son: The Taiping Heavenly Kingdom’ (1996)
- Figes, Orlando — ‘A People’s Tragedy: The Russian Revolution’ (1996)
- Cumings, Bruce — ‘The Korean War: A History’ (2010)
- Turse, Nick — ‘Kill Anything That Moves: The Real American War in Vietnam’ (2013)
- Pinker, Steven — ‘The Better Angels of Our Nature’ (2011)
- Evans, Richard J. — ‘The Third Reich Trilogy’ (2003–2008)
- Mitter, Rana — ‘China’s War with Japan: 1937–1945’ (2013)
200 Million Deaths — And What We Owe to the Record
The ten conflicts documented in this article killed an estimated 200 million human beings. That number should not be allowed to calcify into abstraction. Each figure in each table represents people who had names, families, fears, and futures that were cut short — by artillery, by famine, by deliberate massacre, by the collapse of the systems that keep societies alive. The purpose of maintaining this data is not to sensationalize, but to remember with specificity.
What the data shows, above all, is that wars kill far more civilians than soldiers. This is true across every era and every type of conflict on this list, from the Mongol Conquests to the Second Congo War. The 20th century made this pattern worse, not better — the shift from professional armies to total war, and eventually to deliberate targeting of civilian populations as a military strategy, turned every conflict into a humanitarian catastrophe rather than simply a military one.
There is a reason conflict research institutions like ACLED, the UN OCHA, and the Oxford War Database invest significant resources in casualty documentation. The act of counting is itself a form of accountability. Wars are harder to start, and easier to stop, when their costs are made visible and verifiable. That is why WarCasualties.com exists — and why this record will continue to be updated as history unfolds.
Primary Sources: Oxford War Database · Correlates of War Project · ACLED · Encyclopædia Britannica · Armed Conflict Research Centre · UN OCHA · Individual scholarly works cited per section above.