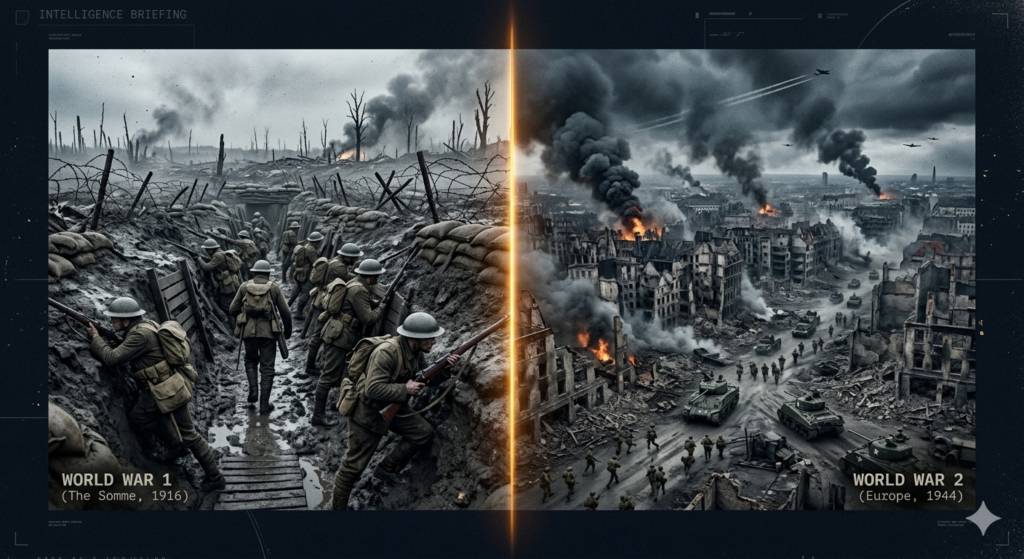
World War I (1914–1918) and World War II (1939–1945) remain the two deadliest military conflicts in all of human history. Together, they claimed an estimated 90–100 million lives across just three decades — reshaping every nation on Earth and defining the political map we live with today.
But the numbers alone don’t tell the full story. How did the two wars compare in terms of who died — military or civilian? Which countries suffered the most? Which single battle was the deadliest? And how does the civilian death toll in WW2 dwarf that of WW1 — and why?
This article compiles verified, source-cited casualty data from historians, government archives, and international research institutions to give you the most complete comparison available anywhere.
Section 01 · At-a-Glance Comparison
WW1 vs WW2: Quick Stats
The fastest way to compare the two deadliest wars in history — side by side
Sources: Imperial War Museum (IWM) · Encyclopædia Britannica · Matthew White, Atrocities: The 100 Deadliest Episodes · ICRC Archives · Niall Ferguson, The Pity of War (1999)
Section 02 · Detailed Breakdown
Full Death Count: Military, Civilian & Total
The most complete death toll comparison table — with source citations for each figure
| Category | Low Estimate | High Estimate | Widely Cited Figure | Source |
|---|---|---|---|---|
| Military Deaths | ||||
| Total Military Dead | 8,500,000 | 10,800,000 | ~9–10 million | IWM / Britannica |
| Killed in Combat | 5,700,000 | 7,000,000 | ~6–7 million | Oxford Research |
| Died of Wounds / Disease | 2,100,000 | 3,200,000 | ~2.5–3 million | IWM Archives |
| Missing / Presumed Dead | 500,000 | 1,000,000 | Not fully counted | ICRC |
| Civilian Deaths | ||||
| Total Civilian Dead | 6,000,000 | 8,000,000 | ~7–8 million | Matthew White |
| Famine & Disease (direct) | 3,500,000 | 5,500,000 | ~4–5 million | UN Historical |
| Armenian Genocide | 600,000 | 1,500,000 | ~1–1.5 million | IAGS / Britannica |
| Spanish Flu (war-linked) | 17,000,000 | 50,000,000 | Often cited separately | WHO / CDC |
| TOTAL (excl. Spanish Flu) | ~17 million | ~20 million | ~17–20 million | Consensus estimate |
| Category | Low Estimate | High Estimate | Widely Cited Figure | Source |
|---|---|---|---|---|
| Military Deaths | ||||
| Total Military Dead | 21,000,000 | 25,500,000 | ~21–25 million | IWM / Britannica |
| Soviet Military Dead | 8,700,000 | 11,400,000 | ~10 million | Russian State Archives |
| German Military Dead | 4,200,000 | 5,500,000 | ~4.4–5.3 million | Overmans (2004) |
| Japanese Military Dead | 2,100,000 | 2,600,000 | ~2.1–2.3 million | Japan MoD Archives |
| American Military Dead | 405,000 | 418,500 | ~418,500 | US National Archives |
| British Military Dead | 380,000 | 450,000 | ~450,000 | UK National Archives |
| Civilian Deaths | ||||
| Total Civilian Dead | 38,000,000 | 55,000,000 | ~40–55 million | Matthew White / Britannica |
| Holocaust (Jewish) | 5,700,000 | 6,100,000 | ~6 million | Yad Vashem |
| Holocaust (Other Groups) | 5,000,000 | 6,000,000 | ~5–6 million | USHMM |
| Soviet Civilian Dead | 13,000,000 | 17,000,000 | ~13–17 million | Russian Archives |
| Chinese Civilian Dead | 7,500,000 | 16,000,000 | ~8–12 million | Chinese Natl. Archives |
| Polish Civilian Dead | 5,100,000 | 5,700,000 | ~5.3–5.7 million | IPN Poland |
| Famine (war-induced) | 3,000,000 | 7,000,000 | Bengal + Greece + others | UN / ICRC |
| TOTAL (All Causes) | ~70 million | ~85 million | ~70–85 million | Consensus estimate |
The Holocaust was the systematic, state-sponsored genocide of approximately 6 million Jews by Nazi Germany and its collaborators between 1941–1945 — representing two-thirds of all European Jews. An additional 5–6 million people from other groups (Roma, disabled, Soviet POWs, political prisoners) were also murdered. The Holocaust is the primary reason why WW2’s civilian death toll so dramatically exceeds WW1’s. There is no equivalent systematic genocide in WW1’s casualty record — making the comparison fundamentally different in nature, not just scale.
Sources: Imperial War Museum (IWM) · Yad Vashem Jerusalem · US Holocaust Memorial Museum (USHMM) · Rüdiger Overmans, Deutsche Militärische Verluste (2004) · Matthew White, Atrocities (2012) · Russian State Military Archives
Section 03 · Nation-Level Data
Country-by-Country Death Toll
Which nations suffered the most — and how WW1 and WW2 compare on a country level
| # | 🏳 | Country | Side | Military Deaths | Civilian Deaths | Total (est.) | Scale |
|---|---|---|---|---|---|---|---|
| 1 | 🇩🇪 | Germany |
Central Powers | ~1.7–2M | ~400,000 | ~2.0–2.4M | |
| 2 | 🇷🇺 | Russia |
Allies (Entente) | ~1.7–1.8M | ~500,000 | ~1.8–2.2M | |
| 3 | 🇫🇷 | France |
Allies (Entente) | ~1.35–1.4M | ~300,000 | ~1.4–1.7M | |
| 4 | 🇦🇹 | Austria-Hungary |
Central Powers | ~1.0–1.2M | ~460,000 | ~1.4–1.7M | |
| 5 | 🇬🇧 | United Kingdom |
Allies (Entente) | ~700,000–900,000 | ~109,000 | ~700,000–1M | |
| 6 | 🇹🇷 | Ottoman Empire |
Central Powers | ~325,000–800,000 | ~2M+ (genocide) | ~2.5M+ total | |
| 7 | 🇮🇹 | Italy |
Allies (1915) | ~460,000–650,000 | ~589,000 | ~600,000–1M | |
| 8 | 🇷🇴 | Romania |
Allies (1916) | ~250,000–335,000 | ~430,000 | ~700,000+ | |
| 9 | 🇺🇸 | United States |
Allies (1917) | ~117,000 | ~757 (minimal) | ~117,000 | |
| ALL NATIONS COMBINED (WW1) | ~9–10 million | ~7–8 million | ~17–20 million | ||||
| # | 🏳 | Country | Side | Military Deaths | Civilian Deaths | Total (est.) | Scale |
|---|---|---|---|---|---|---|---|
| 1 | 🇷🇺 | Soviet Union |
Allied Powers | ~8.7–11.4M | ~13–17M | ~27 million | |
| 2 | 🇨🇳 | China |
Allied Powers | ~3–4M | ~8–16M | ~15–20 million | |
| 3 | 🇩🇪 | Germany |
Axis Powers | ~4.2–5.5M | ~1.5–3M | ~6–9 million | |
| 4 | 🇵🇱 | Poland |
Allied Powers | ~240,000 | ~5.1–5.7M | ~5.6–6 million | |
| 5 | 🇯🇵 | Japan |
Axis Powers | ~2.1–2.3M | ~500,000–1M | ~2.5–3.1 million | |
| 6 | 🇾🇺 | Yugoslavia |
Allied Powers | ~300,000 | ~1.2M | ~1–1.7 million | |
| 7 | 🇫🇷 | France |
Allied Powers | ~210,000 | ~350,000–390,000 | ~600,000 | |
| 8 | 🇬🇧 | United Kingdom |
Allied Powers | ~380,000–450,000 | ~67,000–100,000 | ~450,000–550,000 | |
| 9 | 🇺🇸 | United States |
Allied Powers | ~405,000–418,500 | ~1,700 | ~418,500 | |
| 10 | 🇮🇹 | Italy |
Axis → Allied | ~301,000 | ~153,000 | ~460,000 | |
| ALL NATIONS COMBINED (WW2) | ~21–25 million | ~40–55 million | ~70–85 million | ||||
Sources: Rüdiger Overmans (Germany) · Russian State Archives (USSR) · Institute of National Remembrance / IPN (Poland) · US National Archives · UK National Archives · Australian War Memorial · Britannica
Section 04 · Visual Data
Death Toll Comparison Chart
CSS-rendered bar chart — scale comparison across all major categories
📊 Chart 1 — Total Deaths Comparison (bar = proportion of WW2 total)
📊 Chart 2 — Military Deaths Only
📊 Chart 3 — Civilian Deaths Only (where WW2’s scale becomes catastrophic)
📊 Chart 4 — WW2: Top Nations by Total Deaths (% of Soviet losses)
Section 05 · Year-by-Year Data
Phase-by-Phase Breakdown
How each year of both wars unfolded — and when the killing was worst
Phase
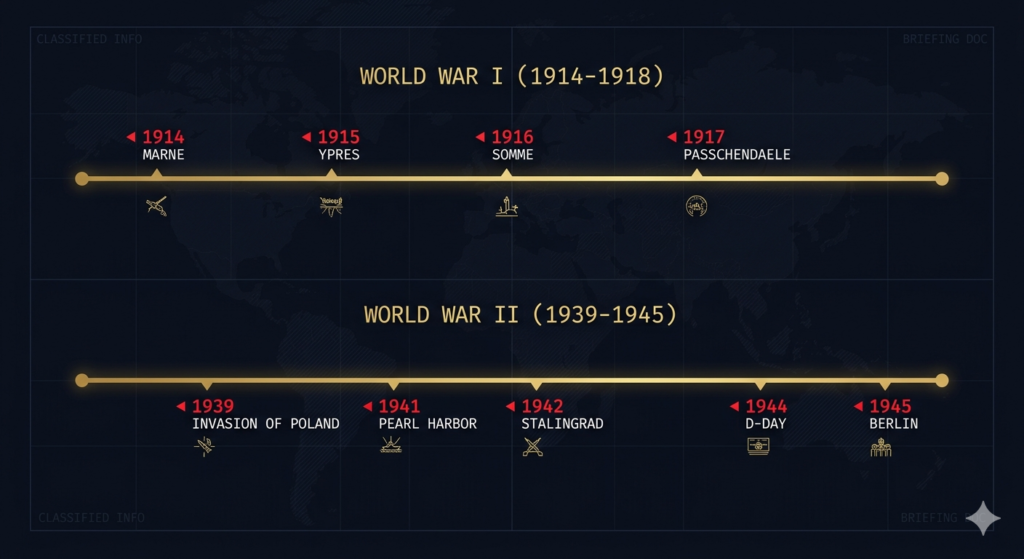
The assassination of Archduke Franz Ferdinand on June 28 triggered a chain of alliances that dragged 8 major powers into war within weeks. Germany’s Schlieffen Plan — designed to defeat France in 6 weeks and then pivot east — failed at the First Battle of the Marne. By Christmas 1914, the Western Front was already a trench system stretching 700 kilometres. Both sides expected a short war; few imagined what was coming.
Begins
Germany’s first use of poison gas at Ypres (April 1915) changed warfare permanently. The disastrous Allied Gallipoli campaign killed ~250,000 from both sides and ended with total withdrawal. Italy entered the war on the Allied side, opening a brutal new front. The Armenian Genocide intensified under Ottoman authority, killing 600,000–1.5 million Armenians.
Year
The Battle of Verdun (Feb–Dec 1916) killed ~300,000 and wounded ~750,000 — France and Germany bled each other for 10 months over a few miles of terrain. Then the Battle of the Somme (July–Nov 1916) opened — British forces suffered 57,470 casualties on Day 1 alone, the worst single day in British military history. The tank was introduced for the first time. Total WW1 deaths in 1916 are estimated at over 2.5 million.
Russia Exits
The US declared war on Germany in April 1917, following unrestricted German submarine warfare. The Russian Revolution removed Russia from the Eastern Front, freeing German divisions. French troops mutinied after catastrophic losses at the Chemin des Dames. The Battle of Passchendaele (Third Ypres) killed ~500,000 for minimal territorial gain — in rain-turned mud so thick men drowned in shell craters.
Year
Germany launched the Spring Offensives (Operation Michael) — a final desperate attempt to win before American troops arrived in force. Initial German gains collapsed. The Allied Hundred Days Offensive (August–November) drove Germany back. Revolution broke out in Germany and Austria-Hungary. The Armistice was signed on November 11, 1918 at 11:00 AM. The 1918–19 Spanish Flu pandemic — killing 50M+ — began spreading through wartime troop movements.
Phase
Germany invaded Poland on September 1, 1939 using a new doctrine of Blitzkrieg — lightning war combining tanks, aircraft, and infantry. Poland fell in 35 days. The Soviet Union invaded Poland from the east on September 17. Britain and France declared war on Germany but launched no major offensive — beginning the “Phoney War.” Poland’s 35,000+ civilians and 70,000 soldiers were killed in the initial campaign.
Falls
Germany conquered Denmark, Norway, Netherlands, Belgium and France in just 46 days (May–June 1940), stunning the world. The Dunkirk evacuation rescued 338,226 Allied troops. Churchill rallied Britain to resist. The Battle of Britain (July–Oct) saw the Luftwaffe attempt to destroy the RAF — and fail. The Blitz began bombing London nightly from September. Italy declared war on Britain and France. Japan continued its brutal conquest of China.
Escalation
June 22, 1941: Germany launched Operation Barbarossa — the largest military invasion in history, with 3+ million German troops attacking the Soviet Union on a 2,900km front. Within months, the Nazis implemented the Final Solution — the systematic mass murder of Jewish people across occupied Europe. On December 7, Japan attacked Pearl Harbor, bringing the United States into the war. By end of 1941 the war involved every major world power.
Holocaust
The Wannsee Conference (January 1942) coordinated the Final Solution — the Holocaust reached its most lethal phase, with death camps operating at full capacity. The Battle of Stalingrad began (Aug 1942 – Feb 1943), killing ~2 million from both sides. The US won the critical Battle of Midway against Japan. The British victory at El Alamein halted German advance in North Africa. 1942 was the year the Holocaust murdered the most people in the shortest time.
Turning
The Battle of Kursk (July 1943) — the largest tank battle in history — ended in a decisive Soviet victory, marking the permanent end of German offensive capability on the Eastern Front. The Allies invaded Sicily and then mainland Italy; Italy surrendered and switched sides. In the Pacific, the US “island-hopping” campaign began grinding toward Japan. By late 1943, the outcome of the war was no longer in serious doubt, yet the killing continued and intensified.
Deadliest
June 6, 1944: D-Day — the Normandy landings, the largest amphibious invasion in history with 156,000 Allied troops. Simultaneously, Operation Bagration on the Eastern Front destroyed Germany’s Army Group Centre — the largest German military defeat of the war, killing 350,000–500,000 Germans. Liberation of France, Belgium, the Netherlands began. The Holocaust’s final acceleration killed 438,000 Hungarian Jews in just 56 days. The Battle of the Bulge — Germany’s last major offensive — cost 100,000+ lives.
Year
Soviet forces encircled Berlin; Hitler died by suicide on April 30, 1945. Germany surrendered on May 8 (V-E Day). In the Pacific, the US island campaigns reached Iwo Jima and Okinawa — the bloodiest Pacific battles. The atomic bombings of Hiroshima (80,000–166,000 killed) and Nagasaki (60,000–80,000 killed) on August 6 and 9 led to Japan’s surrender on August 15 — V-J Day, ending World War II. The Nuremberg Trials began the first international reckoning with war crimes and genocide.
Sources: Anthony Beevor — The Second World War (2012) · John Keegan — The First World War (1998) · Imperial War Museum Timeline Archives · Encyclopedia Britannica Year-by-Year Conflict Data
Section 06 · Deadliest Engagements
The Deadliest Battles: WW1 vs WW2
The individual battles that produced the highest casualty counts in each war
One of history’s bloodiest battles. ~420,000 British, ~200,000 French, ~465,000 German casualties. British gained only 12 km of territory over 141 days.
Germany’s deliberate strategy to “bleed France white.” 10 months of fighting. Ground so contaminated with human remains it cannot be built on to this day.
Germany’s final desperate offensive using elite stormtroopers. Initial breakthroughs ultimately failed. Germany’s army was fatally weakened by the losses it inflicted on itself.
Russia’s most successful offensive. Crushed Austria-Hungary’s Eastern Front army. Historians consider it one of WW1’s most tactically innovative battles.
The longest and most destructive siege in history. ~800,000 civilians died of starvation alone. The city never surrendered over 872 days of encirclement.
The turning point of WW2. Germany’s 6th Army — 300,000 men — was encircled and destroyed. Arguably the most decisive single battle in history’s outcome.
The largest tank battle ever fought. Germany lost ~200,000 men and most of its offensive tank force. After Kursk, Germany never again mounted a major offensive on the Eastern Front.
The final battle of the European war. Soviet forces fought street-by-street through the German capital. Hitler died in his bunker. Germany surrendered within days.
Sources: John Keegan — The Face of Battle (1976) · Antony Beevor — Stalingrad (1998), Berlin: The Downfall 1945 (2002) · Imperial War Museum Battle Records · Smithsonian Magazine Battle Database
Section 07 · Historical Analysis
Why WW2 Killed 4× More Than WW1 — The Full Explanation
Understanding the numbers requires understanding how and why the wars differed in fundamental nature
1. WW2 Deliberately Targeted Civilians — WW1 Mostly Did Not
The single most important explanation for the scale difference is this: WW2 was a war that deliberately targeted civilian populations as a military strategy. The Holocaust killed ~11 million people — none of them soldiers. Germany’s starvation policies in occupied territories deliberately killed millions. Japan’s Nanking Massacre, Unit 731 experiments, and mass civilian killings throughout Asia killed millions more. Allied strategic bombing campaigns killed hundreds of thousands of German and Japanese civilians.
WW1, by contrast, was overwhelmingly fought by soldiers on defined fronts. Civilian deaths occurred — through disease, famine induced by naval blockades, and the Armenian Genocide — but the systematic, state-organized targeting of entire civilian populations as a primary military goal did not exist in WW1 the way it did in WW2.
- WW1 civilian share: ~35–40% of all deaths were civilian
- WW2 civilian share: ~55–65% of all deaths were civilian
- Holocaust: ~11 million killed systematically — zero in a battlefield context
- Leningrad siege: ~800,000 civilians starved to death deliberately
- Hiroshima + Nagasaki: ~140,000–246,000 civilians killed in two days
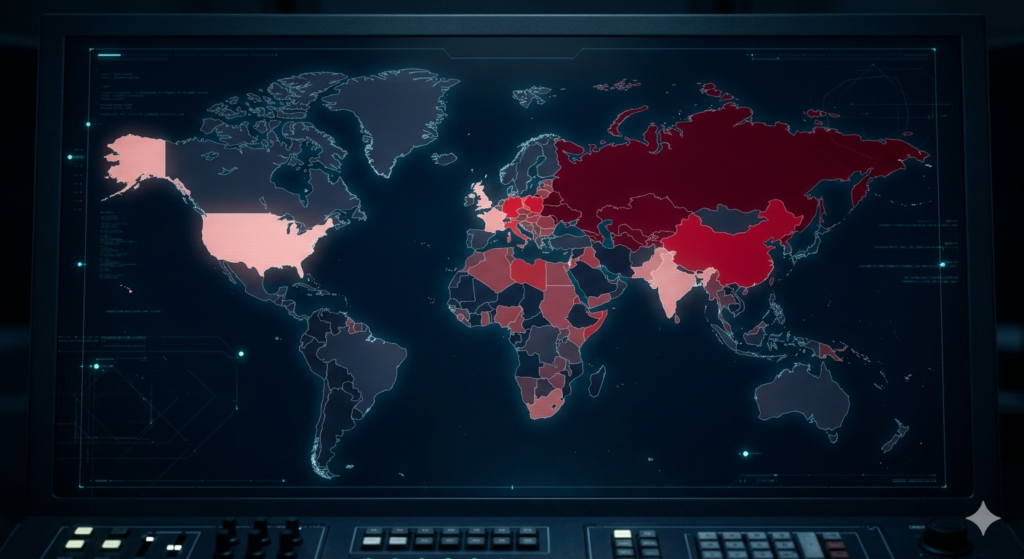
2. WW2 Covered More Geographic Area
WW1 was primarily a European conflict. The Western Front — Belgium to Switzerland — was where the majority of fighting happened. The Eastern Front, Gallipoli, and Middle Eastern theatres added to the count, but the war never truly spread to Asia, the Pacific, or sub-Saharan Africa in a meaningful combat sense.
WW2 was genuinely global. The Pacific Theatre alone spanned millions of square miles, with major land, sea, and air battles across dozens of island groups. The China-Japan war — often considered part of WW2 — killed an estimated 15–20 million people. The North African campaign, the Italian campaign, the bombing of Southeast Asian cities under Japanese occupation — all added to WW2’s death toll in ways WW1 simply never reached geographically.
3. Technology: More Efficient Killing in WW2
WW1 introduced industrial-scale killing but was largely limited to artillery, rifles, and machine guns on defined front lines. WW2 introduced strategic bombing, which could kill thousands of civilians in a single night. The July 1943 Hamburg firestorm killed 35,000–45,000 people in a week of bombing. The Dresden bombing in February 1945 killed 22,700–25,000. Each US atomic bomb killed 80,000–166,000 instantly.
The industrialization of genocide — the gas chambers, the mobile killing units (Einsatzgruppen), the systematic railway deportations — allowed the Holocaust to kill at a scale and efficiency that no WW1 atrocity matched. Technology made WW2’s killing not just larger but categorically different in method.
4. WW1 Ended With Surrender. WW2 Was Fought to Unconditional Surrender
The Armistice of November 11, 1918 ended WW1 while German armies still stood on French soil. Germany was not invaded; the Kaiser abdicated; war stopped by political negotiation. This meant the killing stopped before total destruction of the defeated powers.
WW2 was fought to unconditional surrender — declared at the Casablanca Conference in 1943. Allied forces would not stop until Germany and Japan were completely defeated militarily and politically. This extended the war’s duration — and killing — well past the point where Germany and Japan had any realistic chance of victory. The Battle of Berlin, Iwo Jima, Okinawa, and the atomic bombs all occurred after the war’s outcome was effectively decided — yet killed millions more.
5. The Unresolved Problems of WW1 Made WW2 Possible
Perhaps the most profound historical connection: WW2 happened because WW1 ended badly. The Treaty of Versailles imposed crippling reparations on Germany, created resentment that Adolf Hitler exploited, and redrew borders in ways that created new ethnic conflicts. The Great Depression of the 1930s added economic catastrophe to political instability. WW2 is in many ways the second act of WW1 — which is why some historians refer to the period 1914–1945 as a single “Thirty Years’ War” of the 20th century.
- Systematic civilian targeting: Holocaust, starvation sieges, mass deportations added tens of millions to WW2’s count
- Global geography: Pacific Theatre + China-Japan War added 15–25 million deaths not present in WW1
- Strategic bombing: Air power allowed mass civilian killing far from front lines — technology WW1 barely had
- Unconditional surrender doctrine: Extended fighting 1–2 extra years past Germany/Japan’s effective defeat
- Duration: WW2 lasted 2 years longer, allowing industrialized killing to compound
- Ideology: Nazi racial ideology turned the war into a genocide — WW1 had no equivalent systematic extermination programme
Section 08 · Most-Asked Questions
Frequently Asked Questions
Research-grade answers to the questions asked most often about WW1 vs WW2 deaths
World War 1 killed an estimated 17–20 million people (1914–1918), and World War 2 killed an estimated 70–85 million people (1939–1945). Combined, the two world wars killed approximately 90–100 million people — making them collectively the deadliest events in recorded human history.
World War 2 was approximately 4–5 times deadlier than World War 1. WW1 killed ~17–20 million; WW2 killed ~70–85 million. The primary reasons include the Holocaust (~11 million killed), the Pacific Theatre, strategic bombing campaigns, and the deliberate starvation of civilian populations — none of which had a WW1 equivalent at that scale.
The Soviet Union suffered the highest absolute death toll: approximately 27 million total deaths (~10M military + ~13–17M civilian). In proportional terms, Poland was the worst-affected nation, losing 16–17% of its entire pre-war population — over 5.6 million people from a population of ~35 million.
WW1: approximately 7–8 million civilians died (~35–40% of all deaths). WW2: approximately 40–55 million civilians died (~55–65% of all deaths). The Holocaust alone accounts for ~11 million civilian deaths in WW2 — more than the total civilian deaths in WW1. The deliberate targeting of civilians was a defining and catastrophic feature of WW2 that WW1 did not match.
The Battle of the Somme (July–November 1916) — approximately 1.1 million total casualties, including 57,470 British casualties on Day 1 alone (July 1), the worst single day in British military history. The Battle of Verdun (February–December 1916) is also a contender, with ~300,000 killed over 10 months of fighting for minimal territorial gain.
The Siege of Leningrad (1941–1944) — approximately 1.5 million total deaths including ~800,000 civilians who died of starvation over 872 days. The Battle of Stalingrad (1942–43) produced approximately 2 million total casualties. The Eastern Front overall accounted for roughly 70% of all WW2 military deaths.
Approximately 117,000 Americans died in WW1 (April 1917 – November 1918). Approximately 418,500 Americans died in WW2 (December 1941 – September 1945). While large in absolute terms, American losses were proportionally small compared to the Soviet Union (27 million), China (15–20 million), or Poland (~6 million), because the US mainland was never attacked and entry came after the heaviest fighting had already begun.
Historians widely agree: yes, WW1’s unresolved outcomes directly enabled WW2. The Treaty of Versailles (1919) imposed crippling reparations on Germany, creating the economic desperation and resentment that Adolf Hitler exploited. New borders created ethnic conflict. The Great Depression destabilized Germany further. Many historians describe 1914–1945 as a single “30-year European civil war” with an unstable armistice in the middle.
Section 09 · Conclusion
Conclusion: What These Numbers Mean
A final summary of the key findings — and why this data still matters
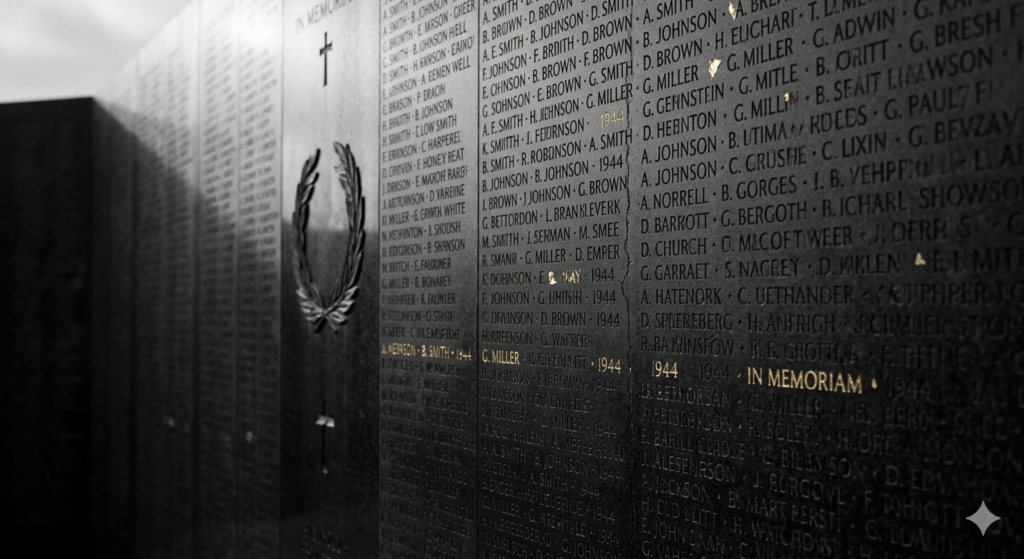
The numbers in this article are not just statistics. Each represents a human life — a soldier who didn’t come home, a child who starved, a family obliterated. When we say WW2 killed 70–85 million people, that means 70–85 million individual experiences of death, grief, and loss compressed into six years.
The comparison between WW1 and WW2 reveals something important: scale is not the only difference that matters. WW2 killed more people primarily because it deliberately chose to — through the Holocaust, through starvation sieges, through the firebombing of cities. WW1’s killing, as catastrophic as it was, was mostly the industrial-age collision of armies. WW2 added genocide, ethnic cleansing, and the systematic murder of civilians as deliberate state policy.
The institutions built after WW2 — the United Nations, the Geneva Conventions, the Nuremberg Principles, the Universal Declaration of Human Rights — were all direct responses to what these numbers represent. The world looked at ~80 million deaths and tried, imperfectly, to build something that would prevent it from happening again. Whether those institutions have succeeded is a question the 2026 conflict data elsewhere on this site continues to answer.
📚 Primary Sources & Bibliography
📤 Share This Research
Disputed Data Policy: Where historians disagree on figures, we present the full documented range and cite the source of each estimate. We do not adjudicate historical disputes — we document them.